Gaussian Naive Bayes for Continuous Features
Bayes Classifier and Naive Bayes
Idea: Estimate $\hat{P}(y | \vec{x})$ from the data, then use the Bayes Classifier on $\hat{P}(y|\vec{x})$.So how can we estimate $\hat{P}(y | \vec{x})$?
One way to do this would be to use the MLE method. Assuming that $y$ is discrete, $$ \hat{P}(y|\vec{x}) = \frac{\sum_{i=1}^{n} I(\vec{x}_i = \vec{x} \wedge \vec{y}_i = y)}{ \sum_{i=1}^{n} I(\vec{x}_i = \vec{x})} $$
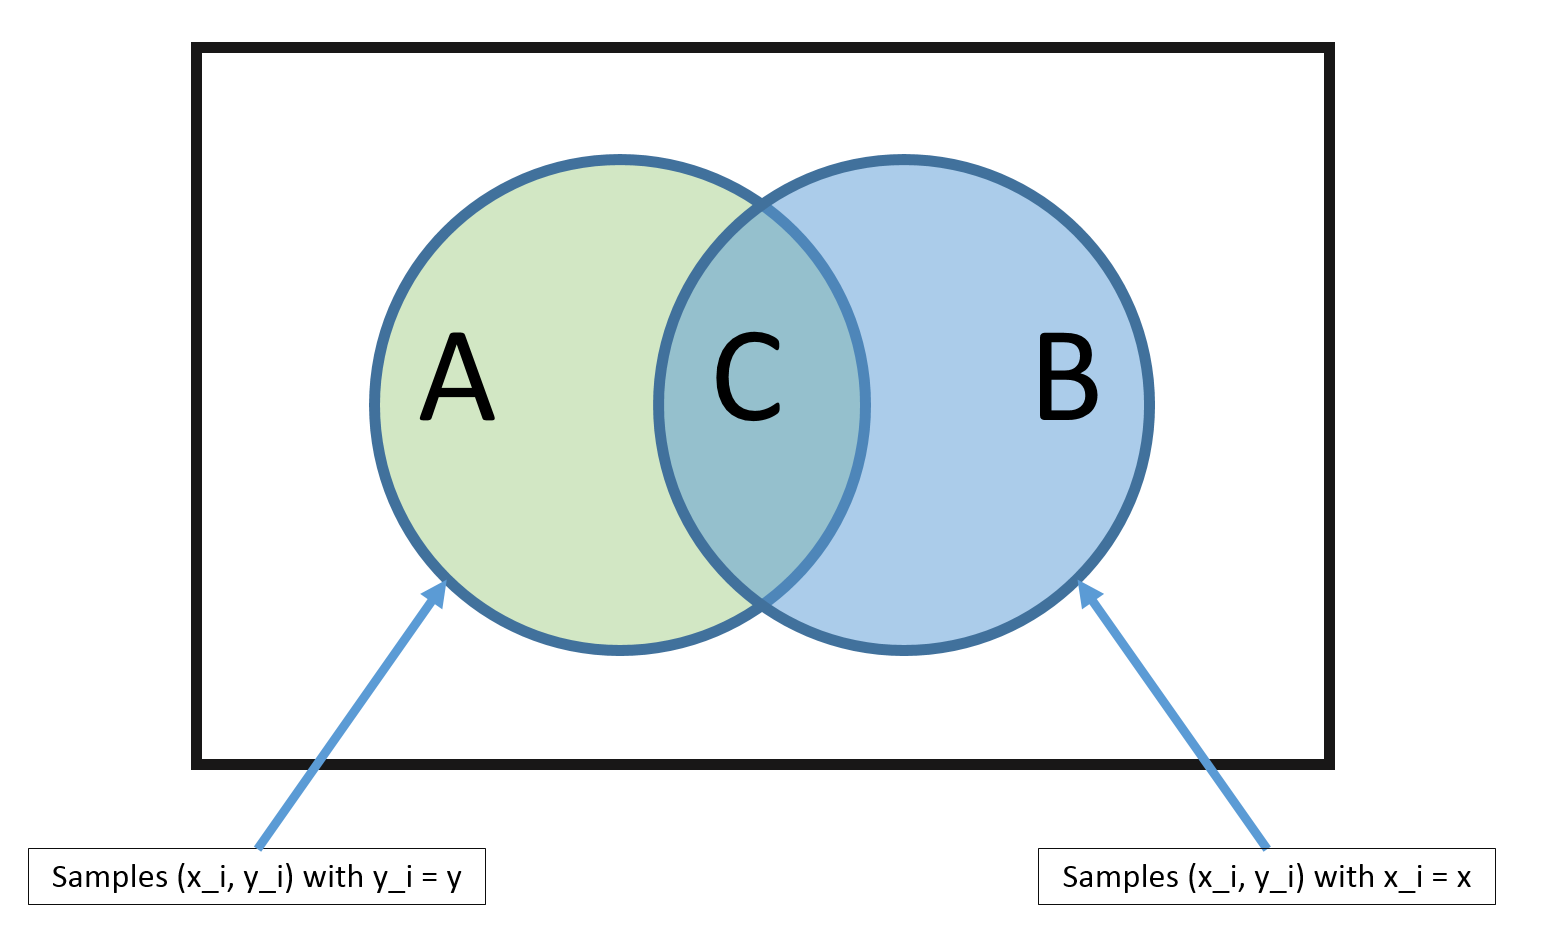
In high dimensional spaces (or with continuous $\vec{x}$), this never happens! So $|B| \rightarrow 0$ and $|C| \rightarrow 0$.
To get around this issue, we can make a 'naive' assumption.
Naive Bayes
We can approach this dilemma with a simple trick, and an additional assumption. The trick part is to estimate $P(y)$ and $P(\vec{x} | y)$ instead, since, by Bayes rule, $$ P(y | \vec{x}) = \frac{P(\vec{x} | y)P(y)}{P(\vec{x})}. $$ Recall from Estimating Probabilities from Data that estimating $P(y)$ and $P(\vec{x} | y)$ is called generative learning.Estimating $P(y)$ is easy. If $Y$ takes on discrete binary values, for example, this just becomes coin tossing. We simply need to count how many times we observe each outcome (in this case each class): $$P(y = c) = \frac{\sum_{i=1}^{n} I(y_i = c)}{n} = \hat\pi_c $$
Estimating $P(\vec{x}|y)$, however, is not easy! The additional assumption that we make is the Naive Bayes assumption.
Naive Bayes Assumption: $$ P(\vec{x} | y) = \prod_{\alpha = 1}^{d} P(x_\alpha | y), \text{where } x_\alpha = [\vec{x}]_\alpha \text{ is the value for feature } \alpha $$ i.e., feature values are independent given the label! This is a very bold assumption.For example, a setting where the Naive Bayes classifier is often used is spam filtering. Here, the data is emails and the label is spam or not-spam. The Naive Bayes assumption implies that the words in an email are conditionally independent, given that you know that an email is spam or not. Clearly this is not true. Neither the words of spam or not-spam emails are drawn independently at random. However, the resulting classifiers can work well in practice even if this assumption is violated.
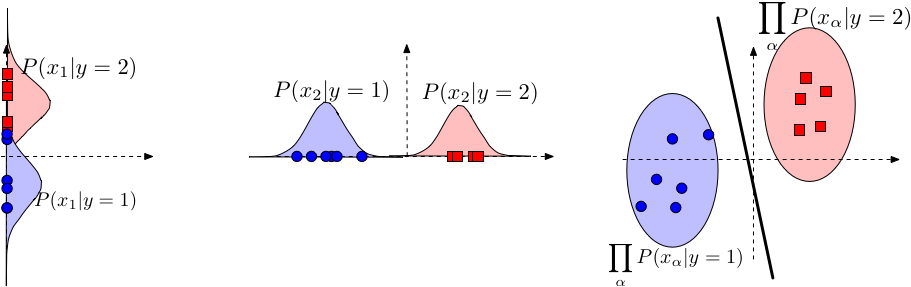
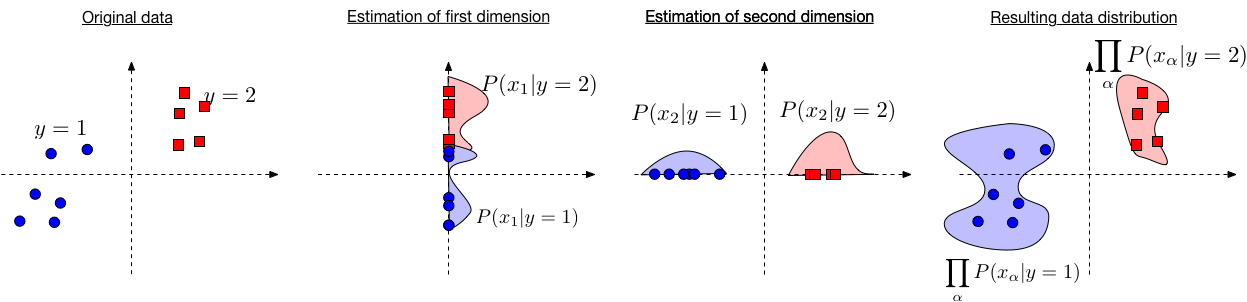 Illustration behind the Naive Bayes algorithm. We estimate $P(x_\alpha|y)$ independently in each dimension (middle two images) and then obtain an estimate of the full data distribution by assuming conditional independence $P(\mathbf{x}|y)=\prod_\alpha P(x_\alpha|y)$ (very right image).
 So, for now, let's pretend the Naive Bayes assumption holds. Then the Bayes Classifier can be defined as \begin{align} h(\vec{x}) &= \operatorname*{argmax}_y P(y | \vec{x}) \\ &= \operatorname*{argmax}_y \; \frac{P(\vec{x} | y)P(y)}{P(\vec{x})} \\ &= \operatorname*{argmax}_y \; P(\vec{x} | y) P(y) && \text{($P(\vec{x})$ does not depend on $y$)} \\ &= \operatorname*{argmax}_y \; \prod_{\alpha=1}^{d} P(x_\alpha | y) P(y) && \text{(by the naive assumption)}\\ &= \operatorname*{argmax}_y \; \sum_{\alpha = 1}^{d} log(P(x_\alpha | y)) + log(P(y)) && \text{(as log is a monotonic function)} \end{align}
Estimating $log(P(x_\alpha | y))$ is easy as we only need to consider one dimension. And estimating $P(y)$ is not affected by the assumption.Estimating $P([\vec{x}]_\alpha | y)$
Now that we know how we can use our assumption to make the estimation of $P(y|\vec{x})$ tractable. There are 3 notable cases in which we can use our naive Bayes classifier.Case #1: Categorical features
 |
| |
In words (without the $l$ hallucinated samples) this means $$ \frac{\text{# of samples with label c that have feature } \alpha \text{ with value $j$ }}{\text{# of samples with label $c$}}. $$ Essentially the categorical feature model associate a special coin with each feature and label. The generative model that we are assuming is that the data was generated by first choosing the label (e.g. "healthy person"). That label comes with a set of $d$ "coins", for each dimension one. The generator picks each coin and tosses it, and fills in the feature value with the outcome of the coin toss. So if there are $C$ possible labels and $d$ dimensions we are estimating $dC$ "coins" from the data, but per example only $d$ of them are tossed. Coin $\alpha$ (for any label) has $K_\alpha$ possible "sides". Of course this is not how the data is generated in reality - but it is a modeling assumption that we make. We then learn these models from the data and during test time see which model is more likely given the sample.
Prediction: $$ \operatorname*{argmax}_y \; P(y=c \mid \vec{x}) \propto \operatorname*{argmax}_y \; \hat\pi_c \prod_{\alpha = 1}^{d} [\hat\theta_{jc}]_\alpha $$Case #2: Multinomial features
 |
| |
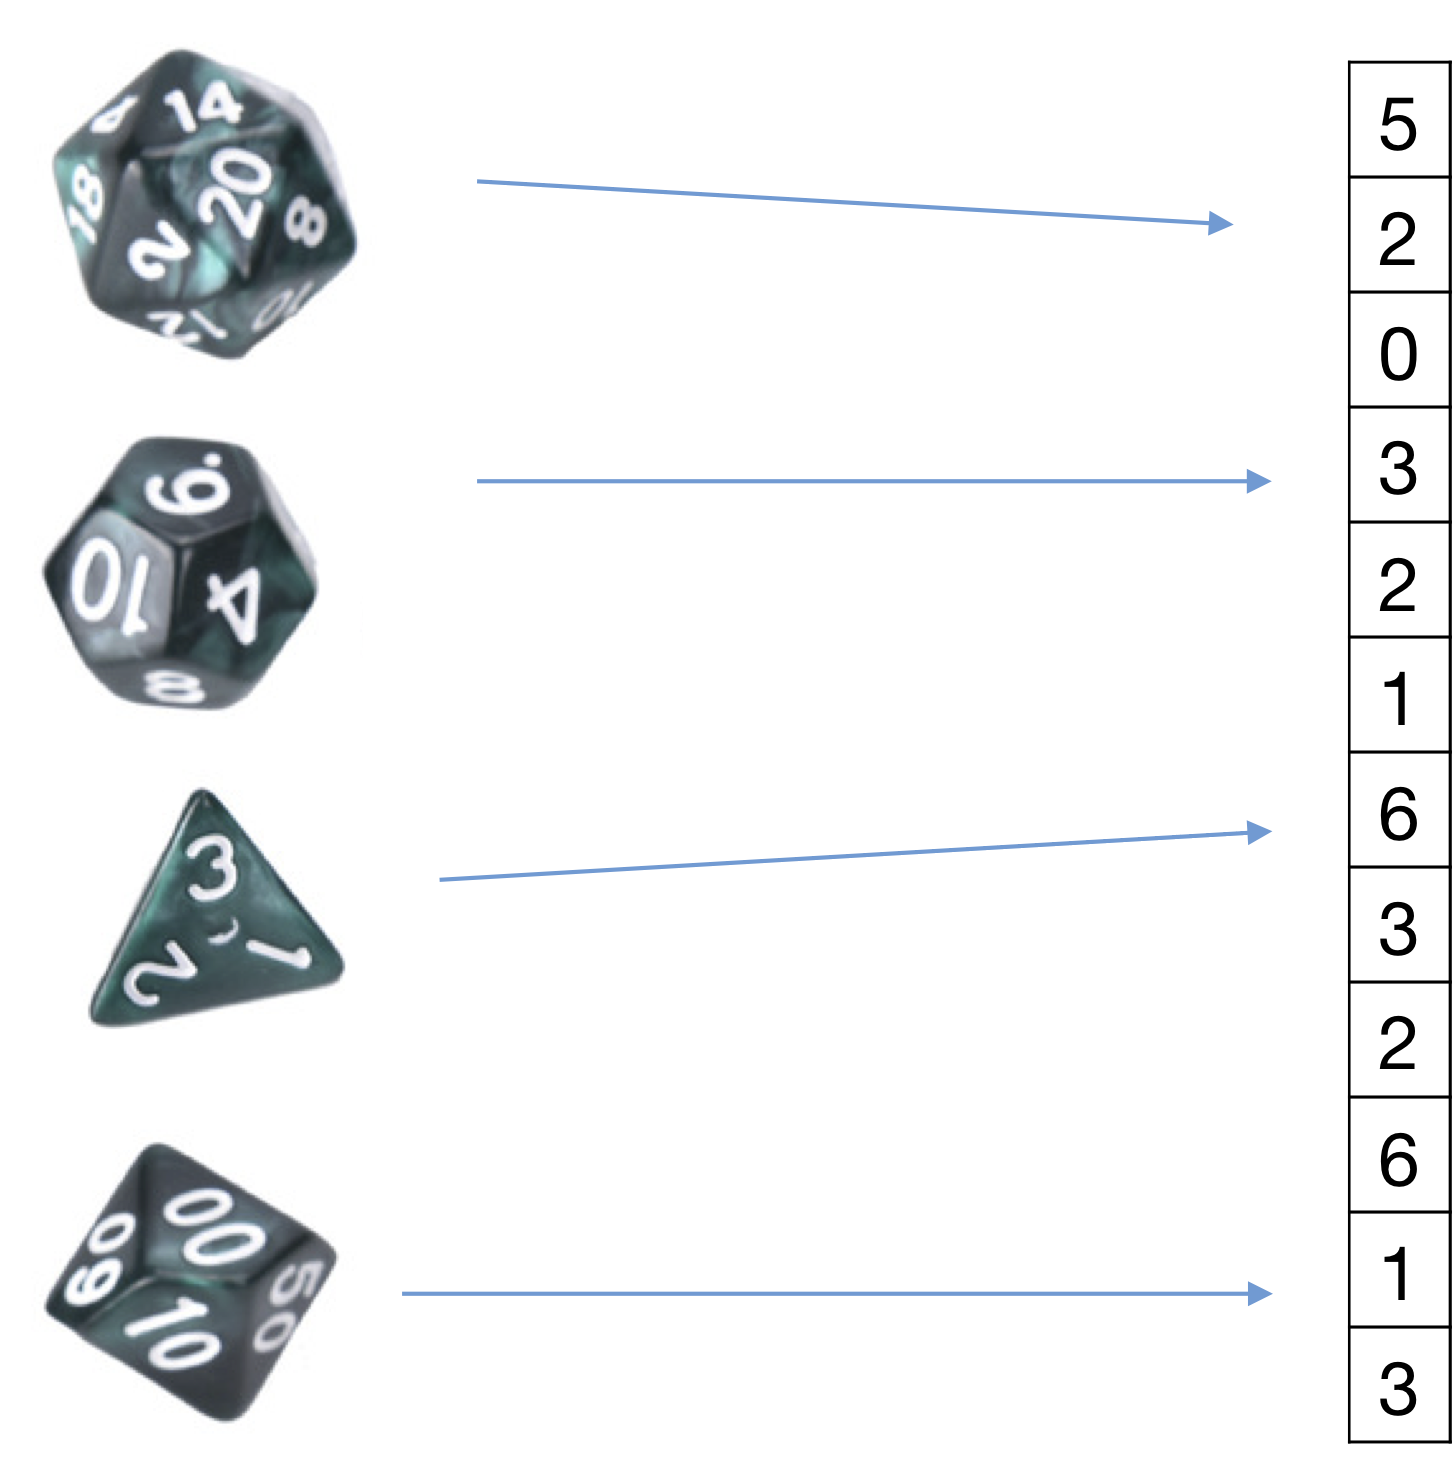
If feature values don't represent categories (e.g. male/female) but counts we need to use a different model. E.g. in the text document categorization, feature value $x_\alpha=j$ means that in this particular document $\vec x$ the $\alpha^{th}$ word in my dictionary appears $j$ times. Let us consider the example of spam filtering. Imagine the $\alpha^{th}$ word is indicative towards ``spam''. Then if $x_{\alpha}=10$ means that this email is likely spam (as word $\alpha$ appears 10 times in it). And another email with $x'_{\alpha}=20$ should be even more likely to be spam (as the spammy word appears twice as often). With categorical features this is not guaranteed. It could be that the training set does not contain any email that contain word $\alpha$ exactly 20 times. In this case you would simply get the hallucinated smoothing values for both spam and not-spam - and the signal is lost. We need a model that incorporates our knowledge that features are counts - this will help us during estimation (you don't have to see a training email with exactly the same number of word occurances) and during inference/testing (as you will obtain these monotonicities that one might expect). The multinomial distribution does exactly that.
Features: \begin{align} x_\alpha \in \{0, 1, 2, \dots, m\} \text{ and } m = \sum_{\alpha = 1}^d x_\alpha \end{align} Each feature $\alpha$ represents a count and m is the length of the sequence. An example of this could be the count of a specific word $\alpha$ in a document of length $m$ and $d$ is the size of the vocabulary. Model $P(\vec{x} \mid y)$: Use the multinomial distribution $$ P(\vec{x} \mid m, y=c) = \frac{m!}{x_1! \cdot x_2! \cdot \dots \cdot x_d!} \prod_{\alpha = 1}^d \left(\theta_{\alpha c}\right)^{x_\alpha} $$ where $\theta_{\alpha c}$ is the probability of selecting $x_\alpha$ and $\sum_{\alpha = 1}^d \theta_{\alpha c} =1$. So, we can use this to generate a spam email, i.e., a document $\vec{x}$ of class $y = \text{spam}$ by picking $m$ words independently at random from the vocabulary of $d$ words using $P(\vec{x} \mid y = \text{spam})$. Parameter estimation: \begin{align} \hat\theta_{\alpha c} = \frac{\sum_{i = 1}^{n} I(y_i = c) x_{i\alpha} + l}{\sum_{i=1}^{n} I(y_i = c) \sum_{\beta = 1}^{d} x_{i\beta} + l \cdot d } \end{align} where the numerator sums up all counts for feature $x_\alpha$ and the denominator sums up all counts of all features across all data points. E.g., $$ \frac{\text{# of times word } \alpha \text{ appears in all spam emails}}{\text{# of words in all spam emails combined}}. $$ Again, $l$ is the smoothing parameter. Prediction: $$ \operatorname*{argmax}_y \; P(y = c \mid \vec{x}) \propto \operatorname*{argmax}_y \; \hat\pi_c \prod_{\alpha = 1}^d \hat\theta_{\alpha c}^{x_\alpha} $$Case #3: Continuous features (Gaussian Naive Bayes)
 |
| |
Features: \begin{align} x_\alpha \in \mathbb{R} && \text{(each feature takes on a real value)} \end{align}
Model $P(x_\alpha \mid y)$: Use Gaussian distribution \begin{align} P(x_\alpha \mid y=c) = \mathcal{N}\left(\mu_{\alpha c}, \sigma^{2}_{\alpha c}\right) = \frac{1}{\sqrt{2 \pi} \sigma_{\alpha c}} e^{-\frac{1}{2} \left(\frac{x_\alpha - \mu_{\alpha c}}{\sigma_{\alpha c}}\right)^2} \end{align} Note that the model specified above is based on our assumption about the data - that each feature $\alpha$ comes from a class-conditional Gaussian distribution. The full distribution $P(\mathbf{x}|y)\sim \mathcal{N}(\vec{\mu}_y,\Sigma_y)$, where $\Sigma_y$ is a diagonal covariance matrix with $[\Sigma_y]_{\alpha,\alpha}=\sigma^2_{\alpha,y}$.
Parameter estimation: As always, we estimate the parameters of the distributions for each dimension and class independently. Gaussian distributions only have two parameters, the mean and variance. The mean $\mu_{\alpha,y}$ is estimated by the average feature value of dimension $\alpha$ from all samples with label $y$. The (squared) standard deviation is simply the variance of this estimate. \begin{align} \mu_{\alpha c} &\leftarrow \frac{1}{n_c} \sum_{i = 1}^{n} I(y_i = c) x_{i\alpha} && \text{where $n_c = \sum_{i=1}^{n} I(y_i = c)$} \\ \sigma_{\alpha c}^2 &\leftarrow \frac{1}{n_c} \sum_{i=1}^{n} I(y_i = c)(x_{i\alpha} - \mu_{\alpha c})^2 \end{align}
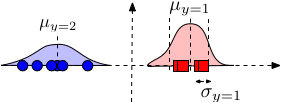
Naive Bayes is a linear classifier
Naive Bayes leads to a linear decision boundary in many common cases. Illustrated here is the case where $P(x_\alpha|y)$ is Gaussian and where $\sigma_{\alpha,c}$ is identical for all $c$ (but can differ across dimensions $\alpha$). The boundary of the ellipsoids indicate regions of equal probabilities $P(\vec{x}|y)$. The red decision line indicates the decision boundary where $P(y=1|\vec{x})=P(y=2|\vec{x})$.
1. Suppose that $y_i \in \{-1, +1\}$ and features are
multinomialWe can show that $$ h(\vec{x}) = \operatorname*{argmax}_y \; P(y) \prod_{\alpha - 1}^d P(x_\alpha \mid y) = sign(\vec{w}^\top \vec{x} + b) $$ That is, $$ \vec{w}^\top \vec{x} + b > 0 \Longleftrightarrow h(\vec{x}) = +1. $$
As before, we define $P(x_\alpha|y=+1)\propto\theta_{\alpha+}^{x_\alpha}$ and $P(Y=+1)=\pi_+$: \begin{align} [\vec{w}]_\alpha &= log(\theta_{\alpha +}) - log(\theta_{\alpha -}) \\ b &= log(\pi_+) - log(\pi_-) \end{align} If we use the above to do classification, we can compute for $\vec{w}^\top \cdot \vec{x} + b$
Simplifying this further leads to \begin{align} \vec{w}^\top \cdot \vec{x} + b > 0 &\Longleftrightarrow \sum_{\alpha = 1}^{d} [\vec{x}]_\alpha (log(\theta_{\alpha +}) - log(\theta_{\alpha -})) + log(\pi_+) - log(\pi_-) > 0 \\ &\Longleftrightarrow \frac{\prod_{\alpha = 1}^{d} P([\vec{x}]_\alpha | Y = +1)\pi_+}{\prod_{\alpha =1}^{d}P([\vec{x}]_\alpha | Y = -1)\pi_-} > 1 \\ &\Longleftrightarrow P(Y = +1 | \vec{x}) > P(Y = -1 | \vec{x}) && \text{(By our naive Bayes assumption)} \\ &\Longleftrightarrow h(\vec{x}) = +1 && \text{(By definition of $h(\vec{x})$)} \end{align}
2. In the case of continuous features (Gaussian Naive Bayes), we can show that $$ P(y \mid \vec{x}) = \frac{1}{1 + e^{-y (\vec{w}^\top \vec{x} +b) }} $$ This model is also known as logistic regression. NB and LR produce asymptotically the same model if the Naive Bayes assumption holds.
Source: https://www.cs.cornell.edu/courses/cs4780/2018sp/lectures/lecturenote05.html
0 Response to "Gaussian Naive Bayes for Continuous Features"
Post a Comment